Birdhouse Components
Scheduler
The scheduler component runs specific jobs on a schedule. This is similar to using the cron
service but this runs in docker containers and is specifically designed to interact with the
Birdhouse stack.
Available jobs
Scheduler jobs can be configured by enabling optional components.
Birdhouse comes with a variety of these Scheduler Jobs in the optional-components directory.
To enable any of these jobs, add the relevant
component directory to the BIRDHOUSE_EXTRA_CONF_DIRS variable in your local environment file.
Custom jobs
To add custom jobs to the scheduler component, create a new component that mounts a .yml configuration file
to the /scheduler-job-configs/ directory inside the scheduler container.
See the components listed above as examples on how to build a similar scheduler job component. For more information about the syntax of the configuration files see the documentation.
The old way to add additional jobs is to update the BIRDHOUSE_AUTODEPLOY_EXTRA_SCHEDULER_JOBS
environment variable in the local environment file to contain a YAML string that describes the job to run.
Note that this method is deprecated and may be removed in the future. Please update all jobs defined in the
BIRDHOUSE_AUTODEPLOY_EXTRA_SCHEDULER_JOBS variable to components.
For example a simple additional job might look like:
if [ -z "$(echo "$BIRDHOUSE_AUTODEPLOY_EXTRA_SCHEDULER_JOBS" | grep 'example job')" ]; then
  export BIRDHOUSE_AUTODEPLOY_EXTRA_SCHEDULER_JOBS="
$BIRDHOUSE_AUTODEPLOY_EXTRA_SCHEDULER_JOBS
- name: example job
  comment: basic job that echos 'something' every hour
  schedule: '1 * * * *'
  command: 'echo something'
  dockerargs: >-
    --rm --name example
"
fi
Note in the example above, the code first checks to make sure that there isn’t already a job named example job.
This is because the local environment file may be read multiple times when it is loaded so it is crucial to ensure that
jobs are not accidentally duplicated.
Automated Deployment
This component provides automated unattended continuous deployment for the
“Birdhouse stack” (all the git repos in var BIRDHOUSE_AUTODEPLOY_EXTRA_REPOS), for the
tutorial notebooks on the Jupyter environment and for the automated deployment
itself.
It can also be used to schedule other tasks on the Birdhouse physical host.
Everything is dockerized, the deployment runs inside a container that will update all other containers.
Automated unattended continuous deployment means if code change in the remote
repo, matching the same currently checkout branch (ex: config changes,
docker-compose.yml changes) a deployment will be performed automatically
without human intervention.
The trigger for the deployment is new code change on the server on the current branch (PR merged, push). New code change locally will not trigger deployment so local development workflow is also supported.
Multiple remote repos are supported so the “Birdhouse stack” can be made of
multiple checkouts for modularity and extensibility. The autodeploy will
trigger if any of the checkouts (configured in BIRDHOUSE_AUTODEPLOY_EXTRA_REPOS) is
not up-to-date with its remote repo.
A suggested “Birdhouse stack” is made of at least 2 repos, this repo and another
private repo containing the source controlled env.local file and any other
docker-compose override for true infrastructure-as-code.
Note: there are still cases where a human intervention is needed. See note in script deployment/deploy.sh.
Usage
Given the unattended nature, there is no UI. Logs are used to keep trace.
${BIRDHOUSE_LOG_DIR}/autodeploy.logis for the Birdhouse deployment.${BIRDHOUSE_LOG_DIR}/notebookdeploy.logis for the tutorial notebooks deployment.logrotate is enabled for
${BIRDHOUSE_LOG_DIR}/*.logto avoid filling up the disk. Any new.logfiles in that folder will get logrotate for free.
How to Enable the Component
Edit
env.local(a copy ofenv.local.example)Add
./components/schedulertoBIRDHOUSE_EXTRA_CONF_DIRS.Set
BIRDHOUSE_AUTODEPLOY_EXTRA_REPOS,BIRDHOUSE_AUTODEPLOY_DEPLOY_KEY_ROOT_DIR,BIRDHOUSE_AUTODEPLOY_PLATFORM_FREQUENCY,BIRDHOUSE_AUTODEPLOY_NOTEBOOK_FREQUENCYas desired, full documentation inenv.local.example.Run once
deployment/fix-write-perm, see doc in script.
Old way to deploy the automatic deployment
Superseded by this new ./components/scheduler component. Keeping for reference only.
Doing it this old way do not need the scheduler component but lose the
ability for the autodeploy system to update itself.
Configure logrotate for all following automations to prevent disk full:
deployment/install-logrotate-config .. $USER
To enable continuous deployment of Birdhouse:
deployment/install-automated-deployment.sh .. $USER [daily|5-mins]
# read the script for more options/details
If you want to manually force a deployment of Birdhouse (note this might not use
latest version of deployment/deploy.sh script:
deployment/deploy.sh .
# read the script for more options/details
To enable continuous deployment of tutorial Jupyter notebooks:
deployment/install-deploy-notebook .. $USER
# read the script for more details
To trigger tutorial Jupyter notebooks deploy manually:
# configure logrotate before because this script will log to
# ${BIRDHOUSE_LOG_DIR}/notebookdeploy.log

deployment/trigger-deploy-notebook
# read the script for more details
Migrating to the new mechanism requires manual deletion of all the artifacts created by the old install scripts:
sudo rm /etc/cron.d/Birdhouse-deploy
sudo rm /etc/cron.hourly/birdhouse-deploy-notebooks
sudo rm /etc/logrotate.d/Birdhouse-deploy
sudo rm /usr/local/sbin/triggerdeploy.sh
Both can not co-exist at the same time.
Comparison between the old and new autodeploy mechanism
Maximum backward-compatibility has been kept with the old install scripts style:
Still log to the same existing log files under
${BIRDHOUSE_LOG_DIR}.Old single ssh deploy key is still compatible, but the new mechanism allows for different ssh deploy keys for each extra repos (again, public repos should use https clone path to avoid dealing with ssh deploy keys in the first place).
Old install scripts are kept and can still deploy the old way.
Features missing in old install scripts or how the new mechanism improves on the old install scripts:
Autodeploy of the autodeploy itself ! This is the biggest win. Previously, if
deployment/triggerdeploy.shor the deployed/etc/cron.hourly/birdhouse-deploy-notebooksscript changes, they have to be deployed manually. It’s very annoying. Now they are volume-mount in so are fresh on each run.env.localnow drives absolutely everything, source control that file and we’ve got a true DevOPS pipeline.Configurable platform and notebook autodeploy frequency. Previously, this means manually editing the generated cron file, less ideal.
Do not need any support on the local host other than
dockeranddocker-compose.cron/logrotate/git/sshversions are all locked-down in the docker images used by the autodeploy. Recall previously we had to deal with git version too old on some hosts.Each cron job run in its own docker image meaning the runtime environment is traceable and reproducible.
The newly introduced scheduler component is made extensible so other jobs can added into it as well (ex: backup), via
env.local, which should be source controlled, meaning all surrounding maintenance related tasks can also be traceable and reproducible.
How to test platform autodeploy is not broken by a PR
There are 2 tests that need to be performed:
Can autodeploy deploy the PR from
masterbranch, the stable reference point?This could fail if some changes in the PR are incompatible with autodeploy. For example:
birdhouse composecalls some binaries that do not exist in the autodeploy docker image.
Can autodeploy be triggered again successfully, after the PR is live?
This could fail if the PR renamed some files and forgot to add the old file names to a
.gitignorefile. Then old file names will appear as new uncommitted files and autodeploy will halt because it expects a clean working directory.
Here is a sample setup to test autodeploy:
Have 2 checkout directories. One is for starting the stack using
birdhouse compose, the other one is to push new bogus changes to trigger the autodeploy mechanism.
# this one for running birdhouse compose
git clone git@github.com:bird-house/birdhouse-deploy.git birdhouse-deploy

# this one for triggering autodeploy
git clone git@github.com:bird-house/birdhouse-deploy.git birdhouse-deploy-trigger
Set
BIRDHOUSE_AUTODEPLOY_PLATFORM_FREQUENCYinenv.localto a very frequent value so you do not have to wait too long for autodeploy to trigger.
# go to the main checkout
cd birdhouse-deploy/birdhouse

# ensure the scheduler component is enabled, otherwise autodeploy will not work
echo 'export BIRDHOUSE_EXTRA_CONF_DIRS="$BIRDHOUSE_EXTRA_CONF_DIRS ./components/scheduler"' >> env.local

# set BIRDHOUSE_AUTODEPLOY_PLATFORM_FREQUENCY
# can set to more frequent than 5 minutes if your machine is capable enough
echo 'export BIRDHOUSE_AUTODEPLOY_PLATFORM_FREQUENCY="@every 5m"' >> env.local

# if scheduler container already running:
# recreate scheduler container for new BIRDHOUSE_AUTODEPLOY_PLATFORM_FREQUENCY to be effective
birdhouse compose stop scheduler && birdhouse compose rm -vf scheduler && birdhouse compose up -d

# if scheduler container not running yet: start the newly added scheduler component
birdhouse compose up -d
Create a
${USER}-testbranch so you can add bogus commits without affecting your real PR. Set up your main checkout (birdhouse-deploy) to track that test branch so it will detect new changes on the test branch and trigger the autodeploy.
# go to the main checkout
cd birdhouse-deploy/birdhouse

# initially create the ${USER}-test branch from master
# the ${USER} prefix is to avoid name clash if another user is also testing autodeploy
git checkout master
git pull
git checkout -b ${USER}-test
git push -u ${USER}-test

# ensure your runnings code is at "master" and is working correctly
# if you do not have a working baseline, you will not know if the breakage is due to autodeploy or your code
birdhouse compose up -d
Test scenario 1, from
masterto your PR
# go to the other checkout to trigger autodeploy
cd birdhouse-deploy-trigger/birdhouse

# set branch ${USER}-test to the same commit as your PR, this will trigger autodeploy from master to your PR
git pull
git checkout ${USER}-test
git reset --hard YOUR_PR_BRANCH
git push

# now that the remote "${USER}-test" branch differs from the local "${USER}-test" branch in the birdhouse-deploy repo,
# the autodeploy mechanism will detect that the remote branch has changed and attempt to update the local branch

# follow logs, check for errors
tail -f ${BIRDHOUSE_LOG_DIR}/autodeploy.log

# each autodeploy trigger will start the log with
#   ==========
#   triggerdeploy START_TIME=2023-06-15T05:07:01+0000

# each autodeploy trigger will end the log with
#   triggerdeploy finished START_TIME=2023-06-15T05:07:01+0000
#   triggerdeploy finished   END_TIME=2023-06-15T05:07:06+0000

# do spot checks in the log, run Jenkins on your deployment if needed
Test scenario 2, from your PR to later changes
# go to the other checkout to trigger autodeploy
cd birdhouse-deploy-trigger/birdhouse

# add any bogus commit to trigger autodeploy again
echo >> README.rst
git add README.rst
git commit -m "trigger autodeploy"
git push

# now that the remote "${USER}-test" branch differs from the local "${USER}-test" branch in the birdhouse-deploy repo,
# the autodeploy mechanism will detect that the remote branch has changed and attempt to update the local branch

# follow logs, check for errors
tail -f ${BIRDHOUSE_LOG_DIR}/autodeploy.log
Test done, clean up the bogus
${USER}-testbranch and optionally relaxBIRDHOUSE_AUTODEPLOY_PLATFORM_FREQUENCY
# go to the other checkout to trigger autodeploy
cd birdhouse-deploy-trigger/birdhouse

# go to master so we can delete the ${USER}-test branch
git checkout master
git push origin --delete ${USER}-test
git branch -D ${USER}-test

# go to the main checkout
cd birdhouse-deploy/birdhouse

# go to YOUR_PR_BRANCH so we can delete the ${USER}-test branch
git checkout YOUR_PR_BRANCH
git branch -D ${USER}-test

# edit env.local and change BIRDHOUSE_AUTODEPLOY_PLATFORM_FREQUENCY to something less frequent to save your cpu
# do not remove the scheduler component from the stack yet or the next command will fail

# recreate scheduler container for new BIRDHOUSE_AUTODEPLOY_PLATFORM_FREQUENCY to be effective
birdhouse compose stop scheduler && birdhouse compose rm -vf scheduler && birdhouse compose up -d

# optionally edit env.local to remove the scheduler component from the stack
# then remove the running scheduler container
birdhouse compose up -d --remove-orphans
Monitoring
This component provides monitoring and alerting for the Birdhouse physical host and containers.
Prometheus stack is used:
Node-exporter to collect host metrics.
cAdvisor to collect containers metrics.
Prometheus to scrape metrics, to store them and to query them.
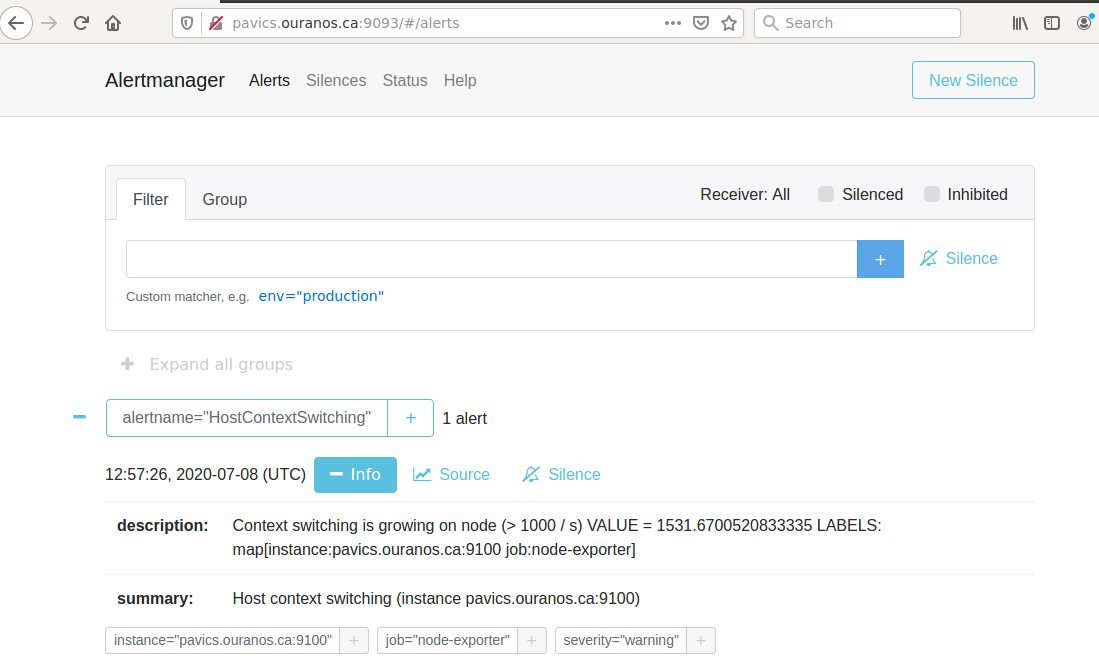
AlertManager to manage alerts: deduplicate, group, route, silence, inhibit.
Grafana to provide visualization dashboard for the metrics.
Usage
Grafana to view metric graphs: https://BIRDHOUSE_FQDN/grafana/d/pf6xQMWGz/docker-and-system-monitoring
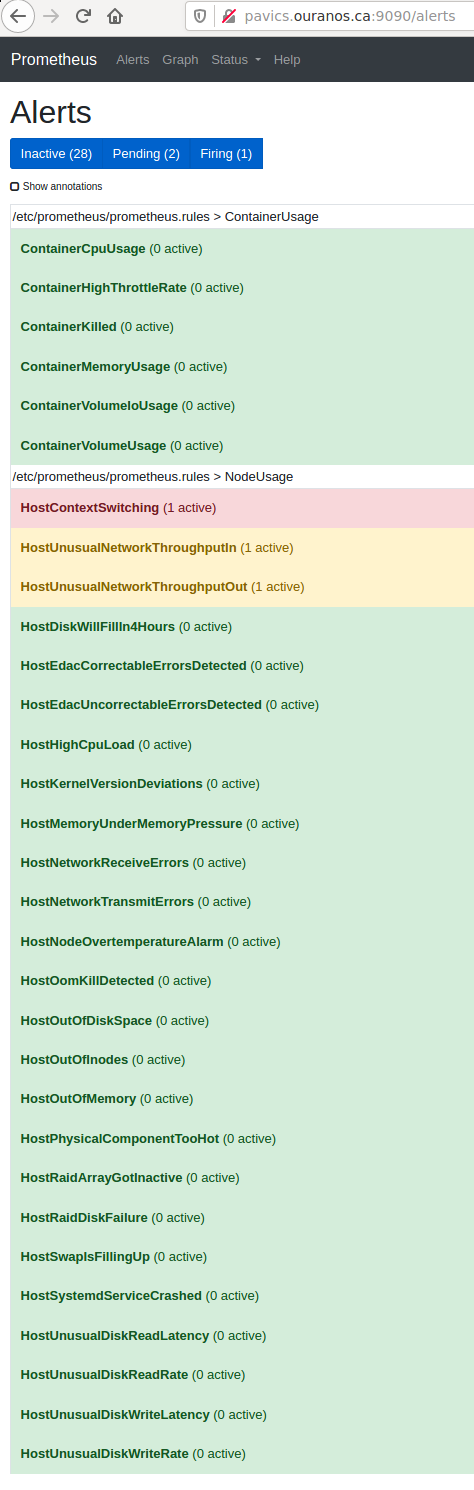
Prometheus alert rules: https://BIRDHOUSE_FQDN/prometheus/rules
AlertManager to manage alerts: https://BIRDHOUSE_FQDN/alertmanager
The paths above are by default only accessible to a user logged in to magpie as an administrator or
as a member of group monitoring. These routes provide sensitive information about the
birdhouse-deploy software stack and the machine that it is running on. It is highly discouraged to
make these routes available to anyone who does not have proper access permissions.
Add existing users to the monitoring group to allow them access to the various monitoring WebUI.
This way, we do not need to share the MAGPIE_ADMIN_USERNAME user account and do not have to add them to the
administrators group, which would give them too much permissions.
How to Enable the Component
Edit
env.local(a copy ofenv.local.example)Add
./components/monitoringtoBIRDHOUSE_EXTRA_CONF_DIRSSet
GRAFANA_ADMIN_PASSWORDto login to GrafanaSet
ALERTMANAGER_ADMIN_EMAIL_RECEIVERfor receiving alertsSet
ALERTMANAGER_SMTP_SERVERfor sending alertsOptionally set
ALERTMANAGER_EXTRA_GLOBALto further configure AlertManagerALERTMANAGER_EXTRA_ROUTESto add more routes than email notificationALERTMANAGER_EXTRA_INHIBITIONto disable rule from firingALERTMANAGER_EXTRA_RECEIVERSto add more receivers than the admin emails
Alert thresholds can be customized by setting the various
PROMETHEUS_*_ALERTvars inenv.local. The list ofPROMETHEUS_*_ALERTvars are inmonitoring/default.env.
Grafana Dashboard
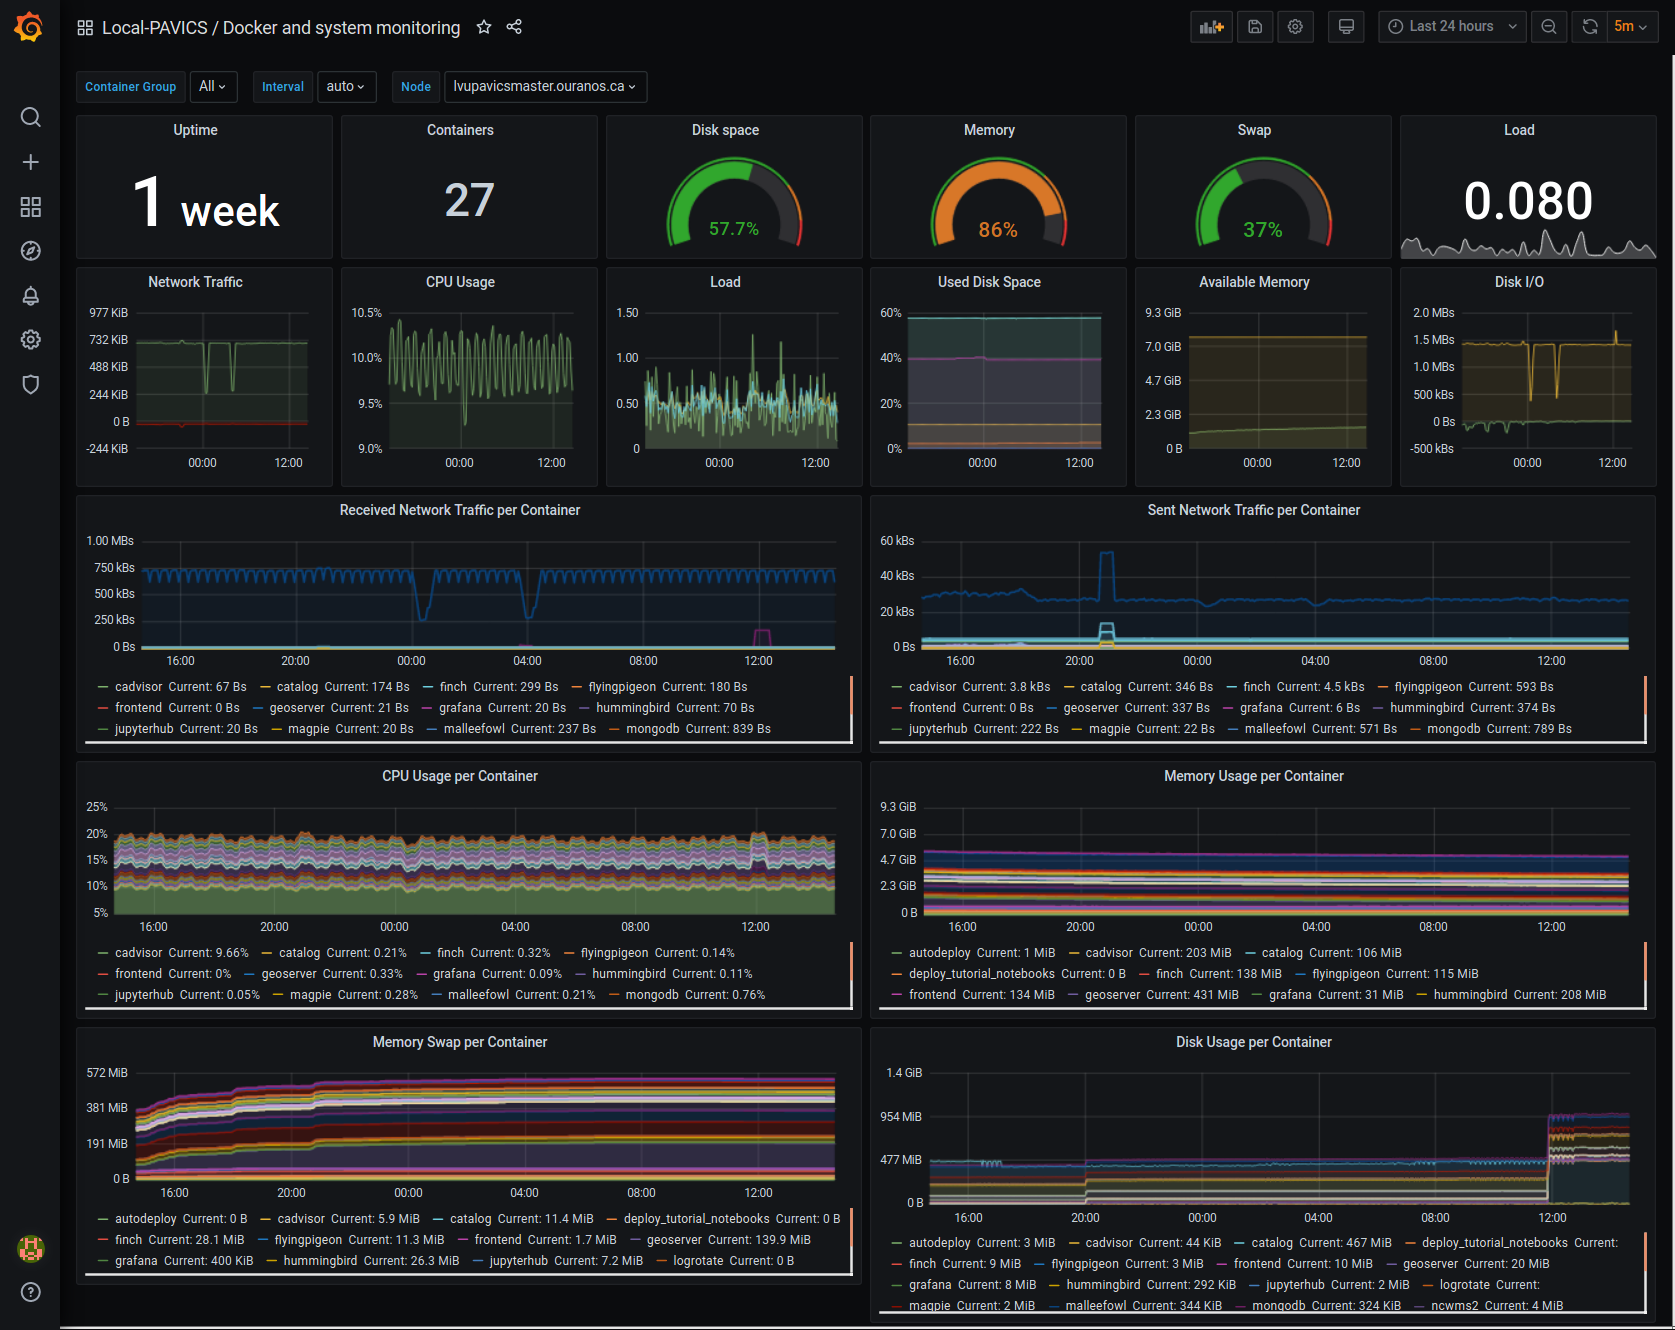
For host, using Node-exporter to collect metrics:
uptime
number of container
used disk space
used memory, available memory, used swap memory
load
cpu usage
in and out network traffic
disk I/O
For each container, using cAdvisor to collect metrics:
in and out network traffic
cpu usage
memory and swap memory usage
disk usage
Useful visualisation features:
zoom in one graph and all other graph update to match the same “time range” so we can correlate event
view each graph independently for more details
mouse over each data point will show value at that moment
Prometheus Alert Rules
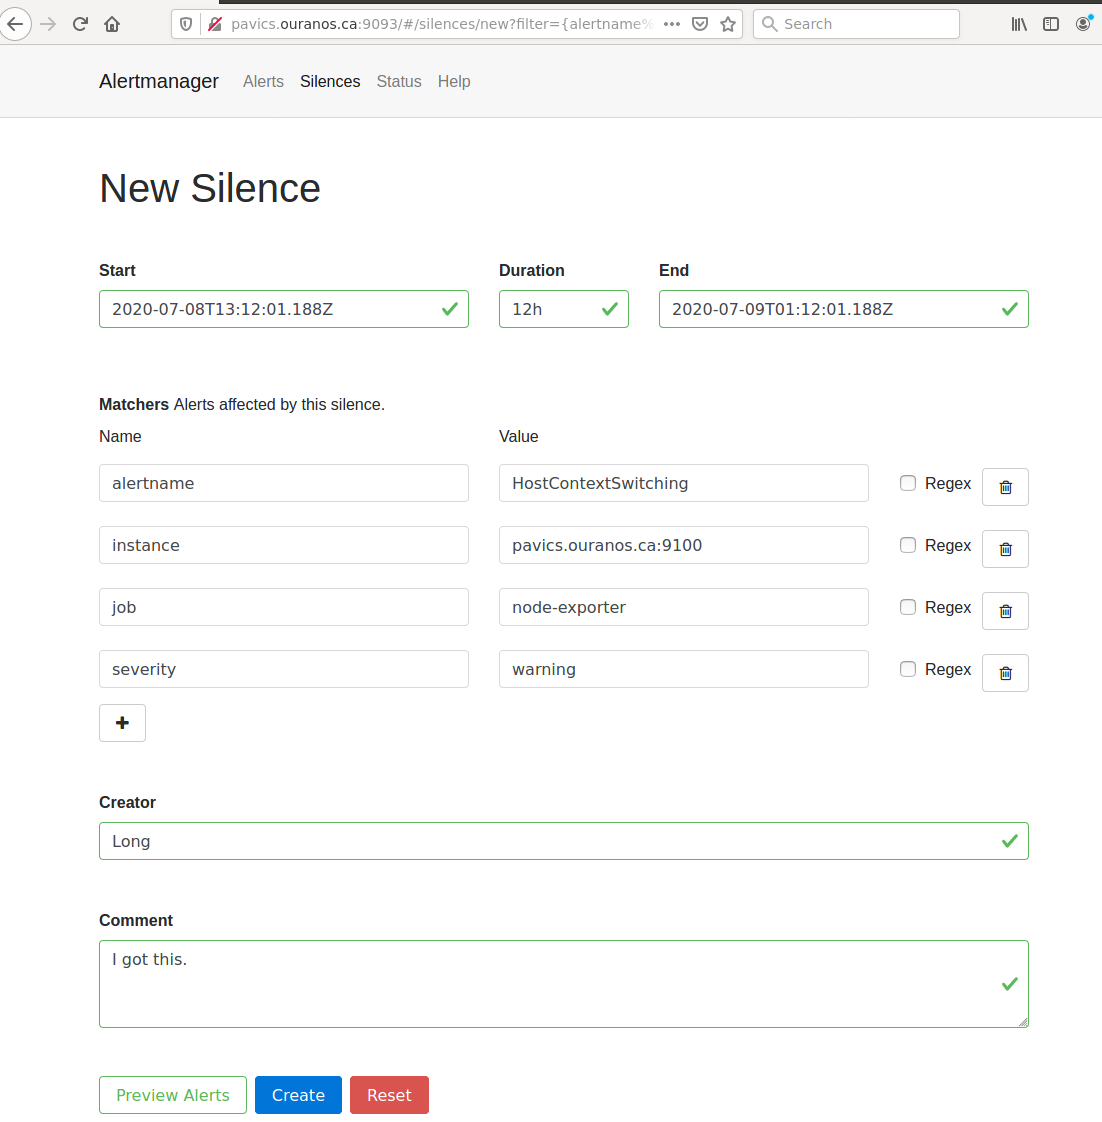
AlertManager for Alert Dashboard and Silencing
Customizing the Component
To add more Grafana dashboard, volume-mount more
*.jsonfiles to the grafana container.To add more Prometheus alert rules, volume-mount more
*.rulesfiles to the prometheus container.To disable existing Prometheus alert rules, add more Alertmanager inhibition rules using
ALERTMANAGER_EXTRA_INHIBITIONviaenv.localfile.Other possible Alertmanager configs via
env.local:ALERTMANAGER_EXTRA_GLOBAL,ALERTMANAGER_EXTRA_ROUTES(can route to Slack or other services accepting webhooks),ALERTMANAGER_EXTRA_RECEIVERS.
Longterm Storage of Prometheus Metrics
Prometheus stores metrics for 90 days by default. This may be sufficient for some use cases but you may wish to store some metrics for longer. In order to store certain metrics for a longer than 90 days, you can enable the following additional components:
./optional-components/prometheus-longterm-metrics: a second Prometheus instance used to collect the metrics that you want to store longterm./optional-components/thanos: a service that enables more efficient storage of the metrics collected by the./optional-components/prometheus-longterm-metricscomponent../optional-components/prometheus-longterm-rules: adds some example rules to the monitoring Prometheus instance (the one deployed by this./components/monitoring) that can be stored longterm by the./optional-components/prometheus-longterm-metricscomponent.
Note
A separate prometheus instance is necessary since the retention time for prometheus metrics is set at the instance level. This means that increasing the retention time must be done for all metrics at once which is undesirable because you probably don’t need to store every metric for a long period of time and you’ll end up using a lot more disk space than needed.
If some or all of these additional components are enabled, they interact in the following way to store certain metrics for longer than 90 days:
recording rules are added to the monitoring Prometheus instance (the one deployed by
./components/monitoring). These rules are any that have thelongterm-metricslabel.The metrics described by these rules are collected/calculated by the monitoring Prometheus instance. The monitoring Prometheus instance treats these rules the same as any other (ie. only stores them for 90 days by default).
To enable some example longterm recording rules, enable the
./optional-components/prometheus-longterm-rulescomponent. You can also choose to create your own rules (see./optional-components/prometheus-longterm-metricsfor details on how to create these longterm metrics rules).
The
./optional-components/prometheus-longterm-metricsPrometheus instance collects/copies only the rules with thelongterm-metricslabel from the monitoring Prometheus instance.The
./optional-components/prometheus-longterm-metricsPrometheus instance stores only these metrics for a custom duration (can be longer than 90 days).
The
./optional-components/thanoscomponent can be deployed alongside the./optional-components/prometheus-longterm-metricsPrometheus instance in order to store the metrics that the./optional-components/prometheus-longterm-metricsPrometheus instance has already collected.The
./optional-components/thanoscomponent collects the metrics collected by the./optional-components/prometheus-longterm-metricsPrometheus instance and stores them in an S3 object store.The
./optional-components/thanosobject store stores the metrics more efficiently, meaning that metrics can be stored for even longer and they’ll take up less disk space than if they were just stored by the./optional-components/prometheus-longterm-metricsPrometheus instance.
Note
It is possible to deploy the ./optional-components/prometheus-longterm-metrics Prometheus instance and
the ./optional-components/thanos instance on a different machine than the monitoring Prometheus instance.
However, note that both the ./optional-components/prometheus-longterm-metrics and ./optional-components/thanos
components must be deployed on the same machine (if both are in use). Also note that this is untested and may
require serious troubleshooting to work properly.
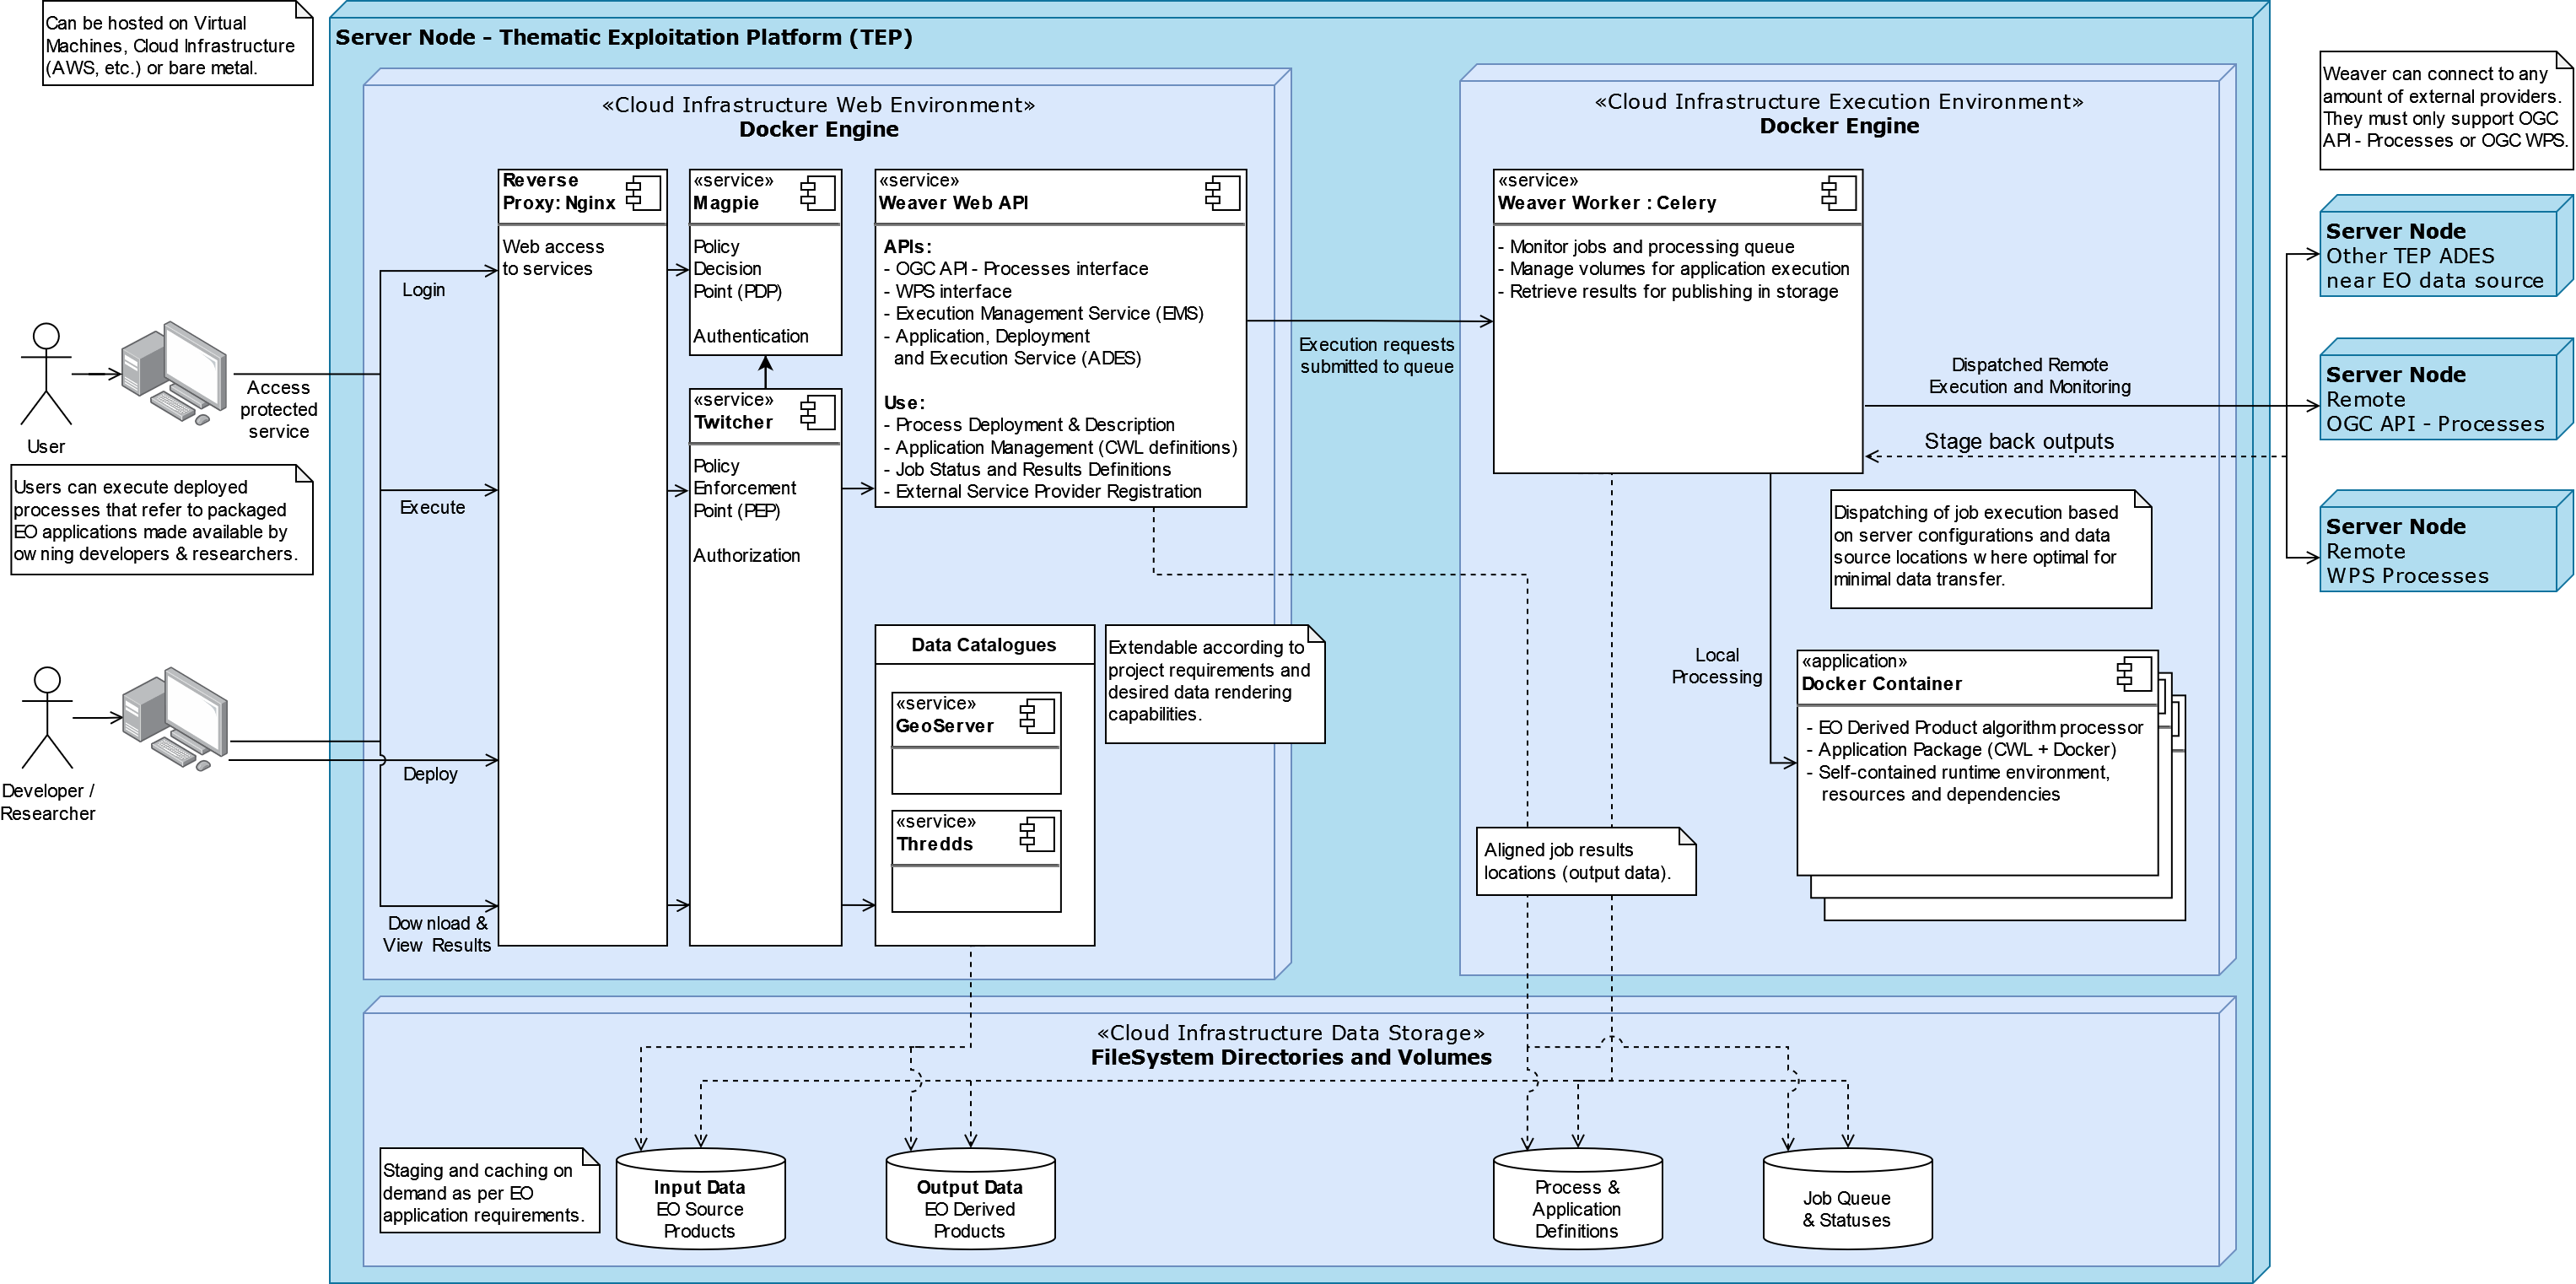
Weaver
By enabling this component, the Weaver service will be integrated into the stack.
This component offers OGC API - Processes interface to WPS components (a.k.a WPS-REST bindings and WPS-T (Transactional) support). This provides a RESTful JSON interface with asynchronous WPS processes execution over remote instances. Other WPS components of the birdhouse stack (finch, flyingpigeon, etc.) will also all be registered under Weaver in order to provide a common endpoint to retrieve all available processes, and dispatch their execution to the corresponding service. Finally, Weaver also adds Docker image execution capabilities as a WPS process, allowing deployment and execution of custom applications and workflows.
Usage
Once this component is enabled, Weaver will be accessible at https://<BIRDHOUSE_FQDN_PUBLIC>/weaver endpoint,
where BIRDHOUSE_FQDN_PUBLIC is defined in your env.local file (a copy of env.local.example).
Full process listing (across WPS providers) should be available using request:
GET https://<BIRDHOUSE_FQDN_PUBLIC>/weaver/processes?providers=true HTTP/1.1
Please refer to the Weaver OpenAPI for complete description of available requests.
This description will also be accessible via https://<BIRDHOUSE_FQDN_PUBLIC>/weaver/api once the instance is started.
For any specific details about Weaver configuration parameters, functionalities or questions, please refer to its documentation.
How to Enable the Component
Edit
env.local(a copy fromenv.local.example)Add
./components/weavertoBIRDHOUSE_EXTRA_CONF_DIRS.Component
./optional-components/all-public-accessshould also be enabled to ensure that Weaver can requestGetCapabilitiesof every WPS provider to be registered. Publicly inaccessible services will not succeed registration and will not provide the WPS-REST interface.
Customizing the Component
Edit
env.local(a copy fromenv.local.example)Optionally, set any additional environment variable overrides amongst values defined in
weaver/default.env.Optionally, mount any additional Weaver-specific configuration files (see contents of
birdhouse/components/weaver/config/weaver) if extended functionalities need to be defined. Furtherdocker-compose-extra.ymlcould be needed to define any othervolumesentries where these component would need to be mounted to.Optionally, set
WEAVER_ALT_PREFIXwith any desired prefix location to use as alternate alias for the/weaver/endpoint. The/weaver/endpoint will remain available. TheWEAVER_ALT_PREFIXalias defines an additional equivalent location to access the service. By default/ogcapiis employed as a common value for this suite of OGC standards.Note that custom prefix values, if specified, should start with a leading
/, and leave out any trailing/. The prefix can also use multiple levels as desired (e.g.:/my/custom/path).If the original
/weaver/endpoint is deemed sufficient, and you would rather omit this additional alias entirely, theWEAVER_ALT_PREFIXvariable should be explicitly set to an empty value.
Managing Large Job Results
The Job Results responses from Weaver
can return a lot of Link headers. This is done to provide job metadata references and provenance traceability
details, but also for actual results locations that can vary in quantity depending on the actual process execution.
By default, the Nginx proxy_buffer_size
and proxy_buffers directives of
the proxy service are added to the Weaver API endpoints with sufficiently large values to avoid HTTP 502 errors
when the response headers exceed the default buffer sizes.
If your processes happen to generate even larger results (e.g.: they return many NetCDF files from batch processing),
you may need to further increase these buffer sizes using
the WEAVER_PROXY_RESPONSE_BUFFER_SIZE and WEAVER_PROXY_RESPONSE_BUFFER_COUNT variables.
If your processes generate a very large number of results, you may also want to consider alternate content negotiation strategies as described in the Job Results and Process Execution Results sections of the Weaver documentation. Certain execution request parameters can be explicitly provided to limit the number of returned headers and their representation in the responses.
Cowbird
Cowbird is a middleware that manages interactions between various birds of the bird-house stack.
It relies on the existence of other services under a common architecture, but applies changes to the resources under those services such that the complete ecosystem can seamlessly operate together (see Components Diagram).
The code of this service is located in Ouranosinc/cowbird. Its documentation is provided on ReadTheDocs.
Operations Performed by Cowbird
Synchronize Magpie user and group permissions between “corresponding files” located under different services. For example, THREDDS user-workspace files visualized in the catalog will be accessible by the same user under the corresponding user-workspace under GeoServer.
Synchronize Weaver endpoints to retrieve equivalent definitions under various paths and access to generated WPS outputs following a job execution by a given user.
Synchronize permissions between API endpoints and local storage files.
Synchronize permissions and references based on event triggers and request callbacks.
Usage
Cowbird is intended to work on its own, behind the scene, to apply any required resource synchronization between the various services of the platform when changes are detected. Therefore, it does not require any explicit interaction from users.
In case the platform maintainer desires to perform manual syncing operations with Cowbird, its REST API should be used.
It will be accessible under https://{BIRDHOUSE_FQDN_PUBLIC}/cowbird and details of available endpoints will be served
under /cowbird/api. Note that Magpie administrator credentials will be required to access those endpoints.
How to Enable the Component
Edit
env.local(a copy fromenv.local.example)Add
./components/cowbirdtoBIRDHOUSE_EXTRA_CONF_DIRS.
Customizing the Component
Cowbird can be affected by multiple variables defined globally on the
stack (i.e.: env.local, a copy of env.local.example). It also considers variables of other services such as
THREDDS, GeoServer, Magpie, etc. in order to perform required interactions between them.
By default, variables defined in cowbird/default.env will be used unless overridden in env.local. To apply changes
define your custom values in env.local directly.
STAC
STAC is the common name of the REST API that implements the STAC specification, common representation of geospatial information.
Usage
The STAC API can be browsed via the stac-browser component. Once this component is enabled, STAC API
will be accessible at the https://<BIRDHOUSE_FQDN_PUBLIC>/stac.
Here is a sample search query using a the pystac-client python CLI:
pip install pystac-client
stac-client search $BIRDHOUSE_FQDN_PUBLIC/stac -q "variable_id=txgt_32" "scenario=ssp585"
Calls to the STAC API pass through Twitcher in order to validate authorization.
By default, only users that belong to the administrator and stac-admin groups will have access to STAC
endpoints. Additional access permissions can be set in Magpie as needed.
To give unauthenticated users read-only access to STAC API resources, enable the optional-components/stac-public-access
component.
How to Enable the Component
Edit
env.local(a copy fromenv.local.example)Add
./components/stactoBIRDHOUSE_EXTRA_CONF_DIRS.
STAC Browser
STAC Browser is a web UI used to interact with the STAC API.
Usage
The STAC API can be browsed via the stac-browser component. By default, the browser will point to the STAC API
exposed by the current ./components/stac service.
Once this component is enabled, the STAC browser will be available
at the https://<BIRDHOUSE_FQDN_PUBLIC>/stac-browser endpoint.
If your STAC API contains GeoJSON data, it is recommended to set the STAC_CORS_ORIGINS value to accept the origin
https://geojson.io since the STAC Browser offers a link to open GeoJSON data at this URL.
Note that you do not need to change the STAC_CORS_ORIGINS value from the default (which accepts all origins), but
if you have changed it please update it to include this origin as well.
If using BIRDHOUSE_PROXY_CORS_ALLOW_ORIGIN overrides, it is also recommended to reference its value within
STAC_CORS_ORIGINS to ensure consistency across the stack.
For example:
# If the STAC_CORS_ORIGINS is currently
export STAC_CORS_ORIGINS='http://example.com ~http:(www|other)\.api\.example\.com'

# you can update it to
export STAC_CORS_ORIGINS='http://example.com ~http:(www|other)\.api\.example\.com https://geojson.io'
How to Enable the Component
Edit
env.local(a copy fromenv.local.example)Add
./components/stac-browsertoBIRDHOUSE_EXTRA_CONF_DIRS.
DGGS: Discrete Global Grid Systems API
OGC API - DGGS is a spatial reference system combining a discrete global grid hierarchy with a zone identifier, in contrast
to typical (lat, lon) spatial reference systems. By using a predefined and deterministic order of zone IDs and
refinement sub-zones, DGGS enables efficient access, representation and analysis of spatial data that has been
quantized over a certain grid reference system (DGGRS).
The OGC API - DGGS definition implemented by this service is a RESTful API that provides access to DGGS resources, definitions, zonal query conversion, and data retrieval from precomputed datasets.
Usage
Once enabled, the API will be accessible (by default) on the /dggs-api endpoint.
It will also be available through the common /ogcapi/dggs alias.
Refer to the DGGS OGC API documentation for specific endpoints and features.
Refer to vgrid DGGS and
the vgrid repository for a relatively extensive
collection of DGGS tools and its associated data manipulation ecosystem (using xarray, QGIS plugin, etc.).
How to Enable the Component
Edit
env.local(a copy fromenv.local.example)Add
./components/dggstoBIRDHOUSE_EXTRA_CONF_DIRS.Define
DGGS_CONFIG_PATHin theenv.localwith custom definitions. Alternatively, employ sample DGGS dataset and configuration by enabling./optional-components/dggs-data-sample. Enabling this optional component will setDGGS_CONFIG_PATHwith a predefined configuration for this sample data. See the PyDGGS-API implementation for more details.Optionally, configure variables in
./components/dggs/default.envviaenv.localto customize the service.
Canarie-API
An endpoint monitoring tool that shows the current status of other components in the software stack.
Usage
The service is available at ${BIRDHOUSE_PROXY_SCHEME}://${BIRDHOUSE_FQDN_PUBLIC}/canarie
How to Enable the Component
Edit
env.local(a copy fromenv.local.example)Add
./components/canarie-apitoBIRDHOUSE_EXTRA_CONF_DIRS.
Finch
Users of climate data are interested in specific indices such as the number of freeze-thaw cycles, the number of degree-days of cooling, the duration of heatwaves, etc. This returns annual values of the most popular climate indices.
Usage
The service is available at ${BIRDHOUSE_PROXY_SCHEME}://${BIRDHOUSE_FQDN_PUBLIC}${TWITCHER_PROTECTED_PATH}/finch
How to Enable the Component
Edit
env.local(a copy fromenv.local.example)Add
./components/finchtoBIRDHOUSE_EXTRA_CONF_DIRS.
GeoServer
GeoServer is the reference implementation of the Open Geospatial Consortium (OGC) Web Feature Service (WFS) and Web Coverage Service (WCS) standards, as well as a high performance certified compliant Web Map Service (WMS), compliant Catalog Service for the Web (CSW) and implementing Web Processing Service (WPS). GeoServer forms a core component of the Geospatial Web.
Usage
The service is available at ${BIRDHOUSE_PROXY_SCHEME}://${BIRDHOUSE_FQDN_PUBLIC}/geoserver. For usage and
configuration options please refer to the Geoserver documentation.
How to Enable the Component
Edit
env.local(a copy fromenv.local.example)Add
./components/geoservertoBIRDHOUSE_EXTRA_CONF_DIRS.
Hummingbird
A Web Processing Service for compliance checks used in the climate science community.
Usage
The service is available at ${BIRDHOUSE_PROXY_SCHEME}://${BIRDHOUSE_FQDN_PUBLIC}${TWITCHER_PROTECTED_PATH}/hummingbird
How to Enable the Component
Edit
env.local(a copy fromenv.local.example)Add
./components/hummingbirdtoBIRDHOUSE_EXTRA_CONF_DIRS.
Jupyterhub
Portal used to launch and manage jupyterlab servers for users. This provides a managed development environment for end-users.
Usage
The service is available at ${BIRDHOUSE_PROXY_SCHEME}://${BIRDHOUSE_FQDN_PUBLIC}/jupyter.
Users are able to log in to Jupyterhub using the
same user name and password as Magpie. They will then be able to launch a personal jupyterlab server.
How to Enable the Component
Edit
env.local(a copy fromenv.local.example)Add
./components/jupyterhubtoBIRDHOUSE_EXTRA_CONF_DIRS.Set the
JUPYTERHUB_CRYPT_KEYenvironment variable
Magpie
Magpie is service for AuthN/AuthZ accessible via a REST API. It allows you to manage User/Group/Service/Resource/Permission management and integrates with Twitcher.
Usage
The service is available at ${BIRDHOUSE_PROXY_SCHEME}://${BIRDHOUSE_FQDN_PUBLIC}/magpie.
For usage and configuration options please refer to
the Magpie documentation.
How to Enable the Component
This component is enabled by default as it is required to securely run the stack
Raven
A suite of WPS processes to calibrate and run hydrological models, including geographical information retrieval and processing as well as time series analysis.
Usage
The service is available at ${BIRDHOUSE_PROXY_SCHEME}://${BIRDHOUSE_FQDN_PUBLIC}${TWITCHER_PROTECTED_PATH}/raven
How to Enable the Component
Edit
env.local(a copy fromenv.local.example)Add
./components/raventoBIRDHOUSE_EXTRA_CONF_DIRS.
THREDDS
Climate Data Catalog and Format Renderers. See the THREDDS documentation for details.
Usage
The catalog is available at the ${BIRDHOUSE_PROXY_SCHEME}://${BIRDHOUSE_FQDN_PUBLIC}/thredds endpoint.
How to Enable the Component
Edit
env.local(a copy fromenv.local.example)Add
./components/threddstoBIRDHOUSE_EXTRA_CONF_DIRS.
Twitcher
Twitcher is a security proxy that provides secure access to other components in the stack. The proxy service uses OAuth2 access tokens to protect the OWS service access using Magpie permissions.
Usage
Twitcher should always be used in conjunction with Magpie and should work already without any additional configuration. For details please refer to the Twitcher documentation.
How to Enable the Component
This component is enabled by default as it is required to securely run the stack
Proxy
An Nginx reverse proxy that serves all other components in the stack through a single proxy endpoint.
Usage
This component is transparent to the end-user as its role is to serve data from other components in the software stack.
How to Enable the Component
This component is enabled by default
mongodb
A NoSQL database used by various other components in the stack as a database backend.
Usage
This component is directly visible to the end-user. It is used by other components in the stack.
How to Enable the Component
Do not enable this component directly. It will be enabled as a dependency of other components.
postgres
A relational database used by various other components in the stack as a database backend.
Usage
This component is directly visible to the end-user. It is used by other components in the stack.
How to Enable the Component
Do not enable this component directly. It will be enabled as a dependency of other components
wps_outputs-volume
Creates a named volume in docker that is shared between WPS and OGCAPI components. This volume will contain the outputs of all processes executed by these services.
Usage
All outputs from these processes will become available at
the ${BIRDHOUSE_PROXY_SCHEME}://${BIRDHOUSE_FQDN_PUBLIC}/wpsoutputs endpoint.
By default, this endpoint is not protected. To secure access to this endpoint it is highly recommended to enable the
./optional-components/secure-data-proxy component as well. Not that this component can also be further customized
with fined-grained access permissions, while retaining the usual public access by combining the the
./optional-components/secure-data-proxy component with the ./optional-components/all-public-access component.
How to Enable the Component
Do not enable this component directly. It will be enabled as a dependency of other components
data-volume
Creates a named volume in docker that is shared between WPS and OGCAPI components. This volume will contain data shared and used by these services.
Usage
This component is transparent to the end-user as its role is to share data between other components in the stack.
How to Enable the Component
Do not enable this component directly. It will be enabled as a dependency of other components
S3
An S3 interface for serving data.
Usage
This S3 interface is read-only for users and it’s intended purpose is to serve data
(like THREDDS, GeoServer, or the ./optional-components/secure-data-proxy).
Administrators can create buckets on S3 using the make-s3-bucket.sh script.
This will create a bucket and create a Magpie resource for that bucket. By default,
only admin users will be able to interact with a new bucket but additional read
permissions can be added to users and groups through Magpie.
For example, to create a bucket named birdhouse:
./birdhouse/scripts/make-s3-bucket.sh birdhouse
Users with permission to access the bucket can then list objects in the bucket or download objects with an S3 tool or SDK.
For example, to list all the object in the birdhouse bucket with the boto3 AWS python SDK:
import boto3
from botocore import UNSIGNED
from botocore.config import Config

client = boto3.client(
  service_name="s3",
  endpoint_url="http://example.com/s3/",
  config=Config(signature_version=UNSIGNED)
)

client.list_objects(Bucket="birdhouse")
The above code will work for resources that are available publicly (i.e. you do not need to log in to Magpie in order to access the resource). If the resource is protected by Magpie you can ensure that you’re passing the relevant authentication information with the request by injecting the session cookies into the request headers.
import boto3
from botocore import UNSIGNED
from botocore.config import Config
import requests

resp = requests.post(
  "http://example.com/magpie/signin",
  json={"user_name": "myusername", "password": "secretpassword"}
)

def add_headers(**kwargs):
  cookie = "; ".join([f"{k}={v}" for k, v in resp.cookies.get_dict().items()])
  kwargs["params"]["headers"]["Cookie"] = cookie

client = boto3.client(
  service_name="s3",
  endpoint_url="http://example.com/s3/",
  config=Config(signature_version=UNSIGNED)
)
client.meta.events.register_first("before_sign.s3.*", add_headers)
client.list_objects(Bucket="birdhouse")
Here is another example using the obstore library:
from obstore.store import S3Store
import requests

resp = requests.post(
  "http://example.com/magpie/signin",
  json={"user_name": "myusername", "password": "secretpassword"}
)

cookie = "; ".join([f"{k}={v}" for k, v in resp.cookies.get_dict().items()])

store = S3Store(
  bucket="birdhouse",
  skip_signature=True,
  endpoint="http://example.com/s3/",
  client_options={"default_headers": {"Cookie": cookie}, "allow_http": True})

store.list()
Administrators can interact with the S3 interface with admin permissions through the
s3-cli service. This uses the AWS CLI tool and supports all subcommands.
For example, to list all buckets:
./bin/birdhouse compose run --rm s3-cli s3 ls
or to add some files to the birdhouse bucket
./bin/birdhouse compose run --rm -v ./files-to-add:/data:ro s3-cli s3 cp /data s3://birdhouse
Administrators can also add files to the birdhouse bucket by adding them directly to the directory
specified by the S3_DATA_STORE config variable. For example, if S3_DATA_STORE=/data/s3-data
and we want to add the same files in the example above to the birdhouse bucket:
cp -r ./files-to-add /data/s3-data/birdhouse/
Note
The s3-cli service is recommended as the preferred way for admins to interact with the S3 service
for two main reasons:
The
s3-cliservice runs in a container with the admin credentials pre-populated. You could also use these credentials throughaws-clibut you’d have to set them manually. The credentials are defined by theS3_ROOT_ACCESS_KEYandS3_ROOT_SECRET_KEYenvironment variables.The
s3-cliservice runs on the same internal docker network as the S3 service so we can target its URL on the docker network directly and bypass Magpie, giving the admin full control. In order to do the same thing withaws-clian admin would have to also include the Magpie token/cookie with theaws-clirequest and there’s no good way of injecting arbitrary headers through theaws-cliinterface.
Note
When setting permission in Magpie, write permissions are ignored and read permissions only apply for buckets and individual files.
For example, an admin can set read permissions on the birdhouse bucket and a file in that bucket
at birdhouse/subdir/file.nc and that will affect whether a user can see the files in birdhouse
and whether they can read that one file.
However, if the admin sets a read permission on birdhouse/subdir/ this will have no effect on whether
the user can or cannot read or browse files with the subdir/ directory prefix. This is because s3
does not have a concept of nested directories within a bucket and subdir is treated as a file name
prefix, not a directory. Because of this, the S3 API does not specify these prefixes in a way that Magpie
can interpret as a nested resource.
How to Enable the Component
Edit
env.local(a copy fromenv.local.example)Add
./components/s3toBIRDHOUSE_EXTRA_CONF_DIRS.
logging
Sets default logging options for all docker compose services started by bin/birdhouse and birdhouse-compose.sh.
The default value is set by the BIRDHOUSE_DOCKER_LOGGING_DEFAULT environment variable. To change the default
value, set the BIRDHOUSE_DOCKER_LOGGING_DEFAULT to a JSON string in the local environment file that contains
a valid docker compose logging configuration.
For example, to set the default driver to "local" set the following in your local environment file:
You can also override logging options for a single service using environment variables using a variable
BIRDHOUSE_DOCKER_LOGGING_<service_name> where <service_name> is the uppercase name of the docker compose service
with hyphens replaced with underscores. For example, to set the default driver to "local" only for
the weaver-worker service:
Logging options can can also be set directly in a component’s docker-compose-extra.yml file. The order of
precedence for logging options are as follows:
logging options specified by
BIRDHOUSE_DOCKER_LOGGING_<service_name>environment variablelogging options set in a
docker-compose-extra.ymlfilelogging options specified by
BIRDHOUSE_DOCKER_LOGGING_DEFAULTenvironment variable